Writing / coding / technical notes
Blog
A mix of technical and not-so-technical writing, from research notes to experiments and interactive stories.
Subscribe via RSSBicing in Barcelona: an analysis of seven years of data
An Observable notebook analyzing trends and patterns in seven years of Bicing station data.
- Data Visualization
- Urban Mobility
- Barcelona
- Observable
- Interactive
Who was the best tennis player?
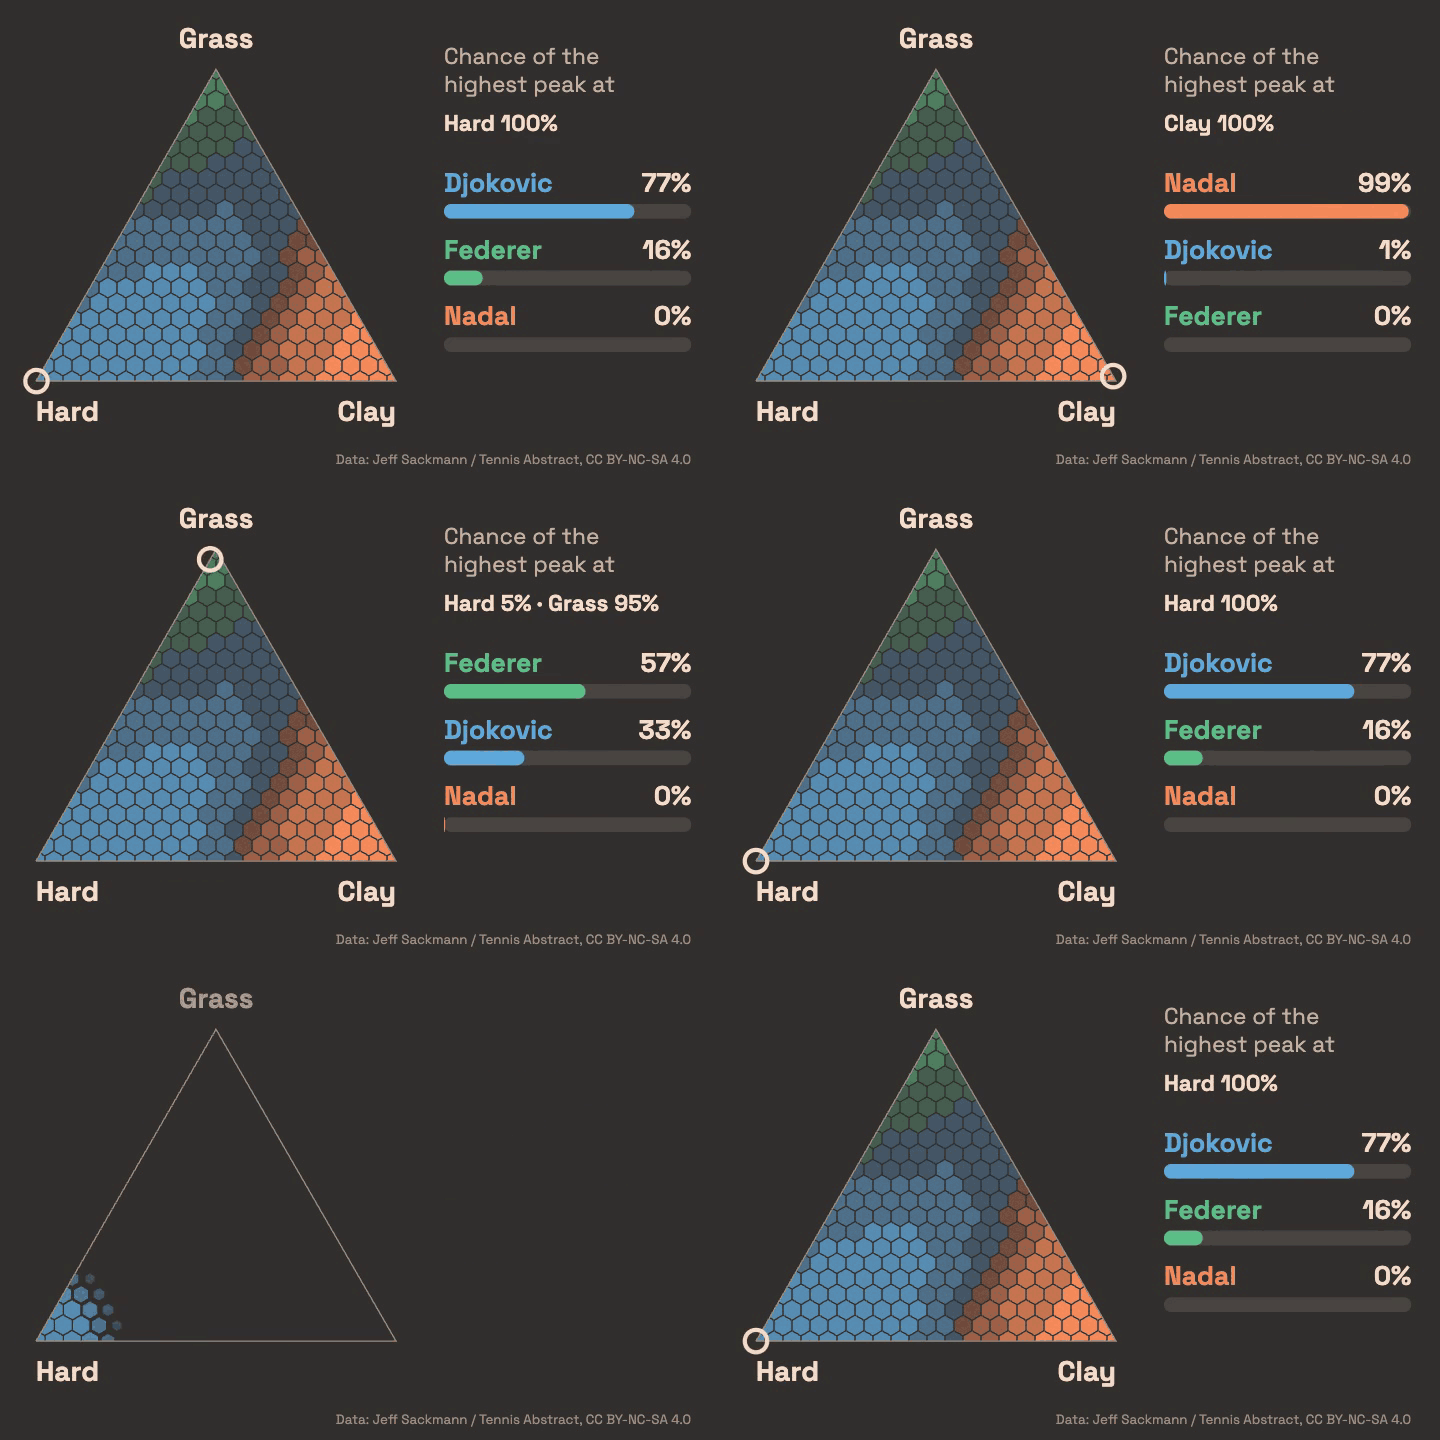
An interactive story showing the analysis of every ATP-tour (tennis) level match since 1980 using a bayesian model that tries to reconstruct a dynamic latent strength for every player.
- Data Visualization
- Bayesian Statistics
- Tennis
- D3
- Interactive
Grammar of graphics for SQL? Trying GGSQL
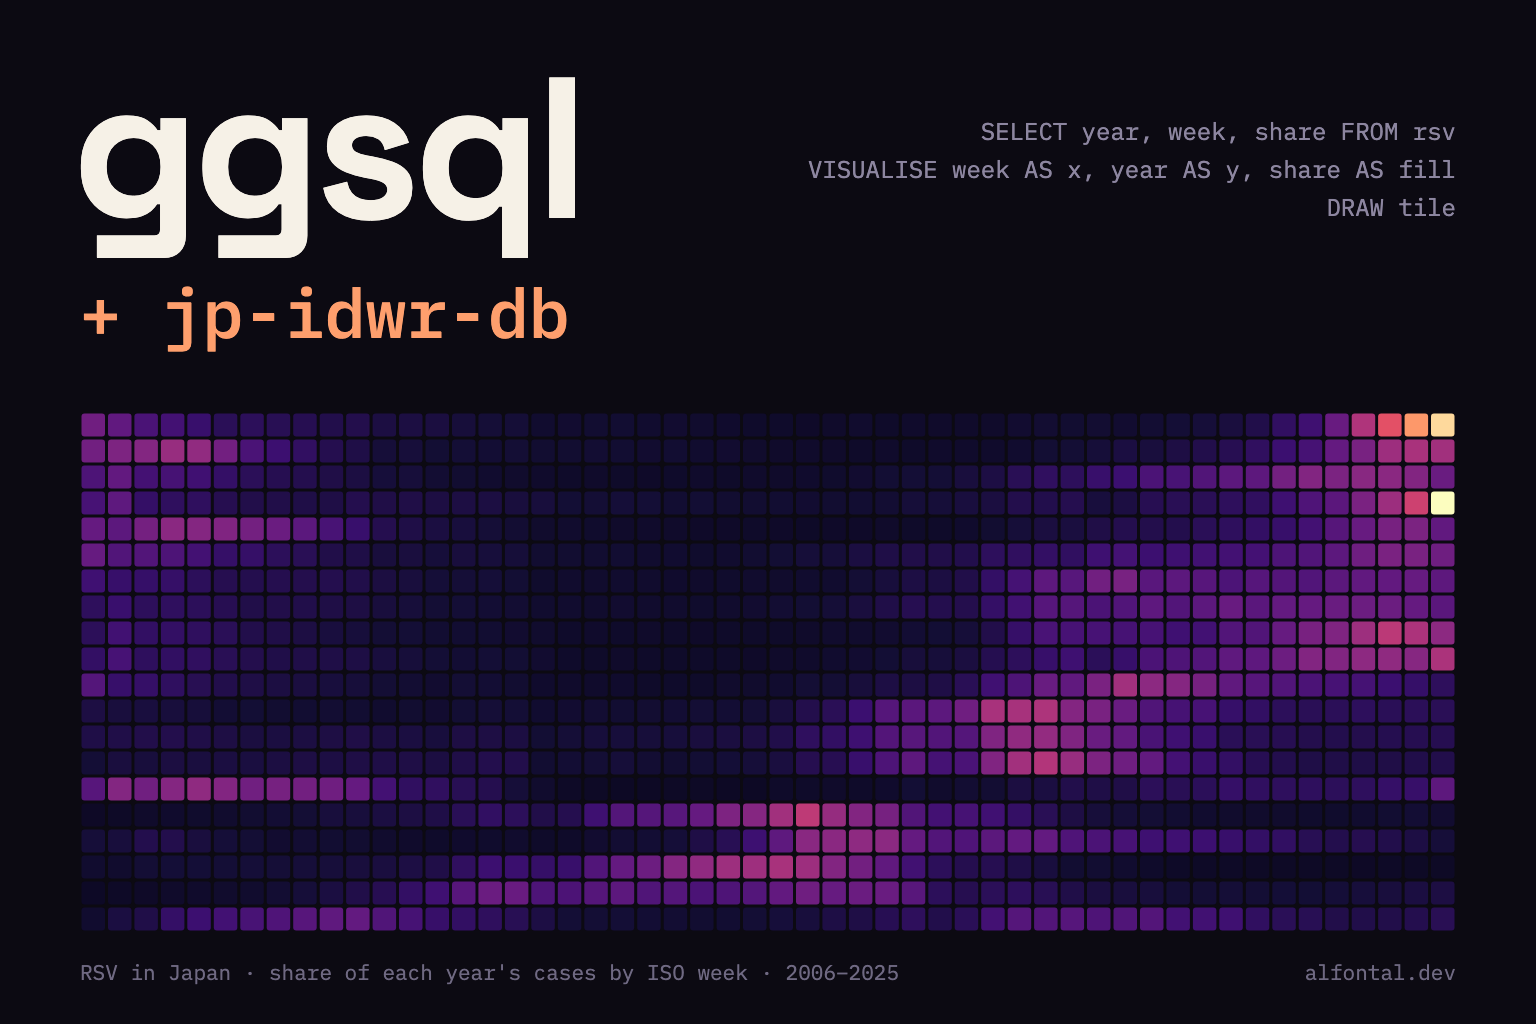
Querying, analyzing and plotting Japanese infectious surveillance data with nothing but SQL
- Data Visualization
- SQL
- ggsql
- DuckDB
- Epidemiology
- Japan
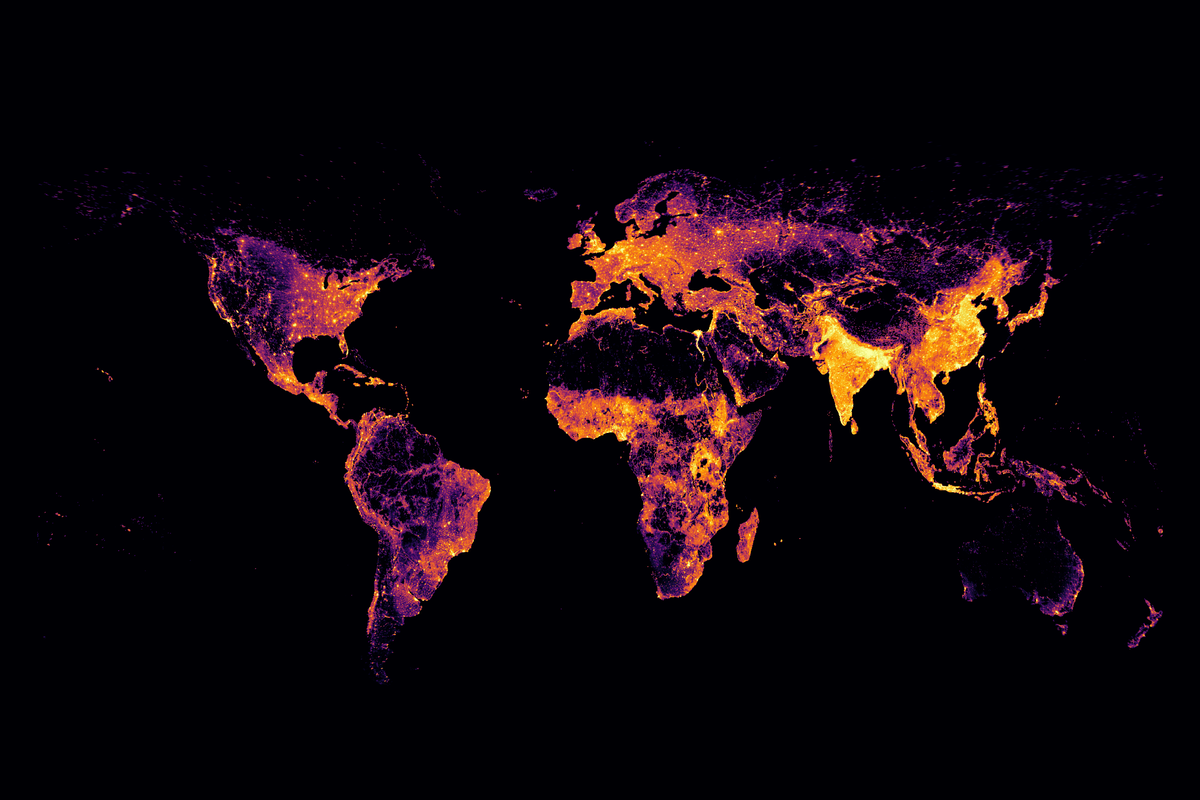
Mapping world population density
Global population density maps built with xarray and plotnine.
- Data Visualization
- Python
- GIS
- plotnine
- xarray
Vegetation, land use and Google's Earth Engine API
Exploring vegetation and land-use patterns across Asia with Google Earth Engine.
- Remote Sensing
- Earth Engine
- GIS
- Land Use
Tracing Tokyo's air sources to identify Kawasaki Disease's etiological triggers
Conference report on Kawasaki disease incidence in Tokyo and differential HYSPLIT back-trajectory source regions.
- Kawasaki Disease
- Epidemiology
- Atmospheric Transport
- HYSPLIT
- Python
- Reproducibility